
Parsing technical patterns
"And some things that should not have been forgotten were lost. History became legend. Legend became myth. And for two and a half thousand years, the ring passed out of all knowledge."
― J.R.R. Tolkien, The Lord of the Rings
Using chart patterns and technical analysis to predict the future movements are most mysterious and controversial topics in real financial world. Despite the great success of the efficient market hypothesis get broad acceptance in main street folks, there are still "smart" trader claimed that their excessive fortune came from technical analysis. People argues that such successes suffered the survive bias. Press and medias are more focusing on the selective individual trade, but ignore the ordinary others. Although in long term, the asset price may eventually behaviored as the capital asset pricing model (CAPM) described. In reality, especially in short term, people are still expect to see a "Robin Hood" trader or a strategy to somehow break the institution's martingale.
Let's forget about the specific technical pattern in the chart. Among other issues, the most fundamental question we have to encountered at first is "Does the history do help to predict the future?"
Well if the market are truly efficiency, then the answer is no. However, it will only happens in the text book. The market are typically trade for it's future which are unknown for everybody. The consensus are divergent and sometimes even driven by the current trading price based on George Soros' reflexivity theory. Besides the divergent fundamental assumptions, the short term assets pricing are also driven by the liquidity as well. The supplies and demands are playing essential roles to shape the price trend line. Since the institution's block trade will affect the current price more or less based on the liquidity, such reflexivity are happens frequently. Even the most sophisticated execution still have the impact on market.
In overall, either the equity analysts, or the execution trader can not ignore the historical price information. And some of them are taking advantage of it for quite a long time to better understand the market.
Nobody can fully ignore the predictive power of the technical patterns. In 2000, an article from Economist reports the potential usage of the heads, shoulders and broadening bottoms patterns in chart analysis. And it argues that such predictive power might be more effective when the market have more individual investors. The report hint the reflectivity may plays an important role for such behavior, but it still can not go to explore the cause of such patterns from scientific point of view. As a result, it suggests the technical analysis are more like an art than a science.
Quantitative models review
The problem of the technical analysis as well as the George Soros' reflexivity theory are lack of mathematic foundation. Unlike in an efficient market where prices reflect all available information. Scouring past prices for patterns suggest nothing useful about future. Hence the prices will move unpredictably, a.k.a mathematically favored "Random Walk". Well if the future are not only depend or conditionally depend on the the current price, then historical model will start become valuable and complicated.
In the basic assumption, the future change will only follows a zero mean Gaussian distribution.
The only parameter \( \sigma^2 \) will be a static number comes from the empirical variance.
In modern portfolio theory, \( \sigma^2 \) is used to define the risk and volatility.
By interpreting this model, we can obtain the distribution, as well as the expected return which is sadly zero.
All it required are the current price, and one simple statistic - 'variances' from the historical data.
Later, analysts found out that the static parameter \( \sigma^2 \) assumption is too weak from empirical observation.
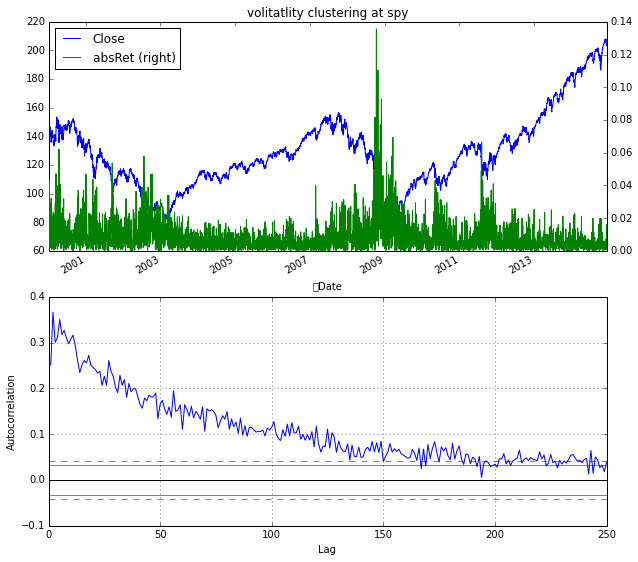
There is a fact called volatility clustering that suggest a more advanced ARCH and GARCH model that can consider more historical information.
The main idea behind these two models is that volatility is dependent upon past realizations of the asset process and related volatility process.
Essentially, it extend the static volatility assumption to a dynamic correlated one.
Well better modeling volatility may seems exciting, but the model itself suggest no alpha and zero expected return (or unbiased from their assumption) again.
Therefore, such model are more useful when considering value-at-risk and in the derivative market where volatility can generate 'alpha' or formally Vega in options Greeks.
The ARCH model hint us an indirect way to model the underlying price through modeling the auxiliary process. The historical information are selectively used in modeling auxiliary process to better predict the future. This may eventually remind us to use Bayesian framework by leveraging the historical prior information to improve the future prediction.
Technical patterns detection
In order to analyze the potential impact of the technical patterns,
we should define those patterns first, then detect them in second.
Compares to most statistically significant patterns, the technical patterns are more determined from geometric standard.
In reference Wang2000 and other chart analysis package [e.g. TA-lib], they define chart patterns through rules based methodology.
For example,
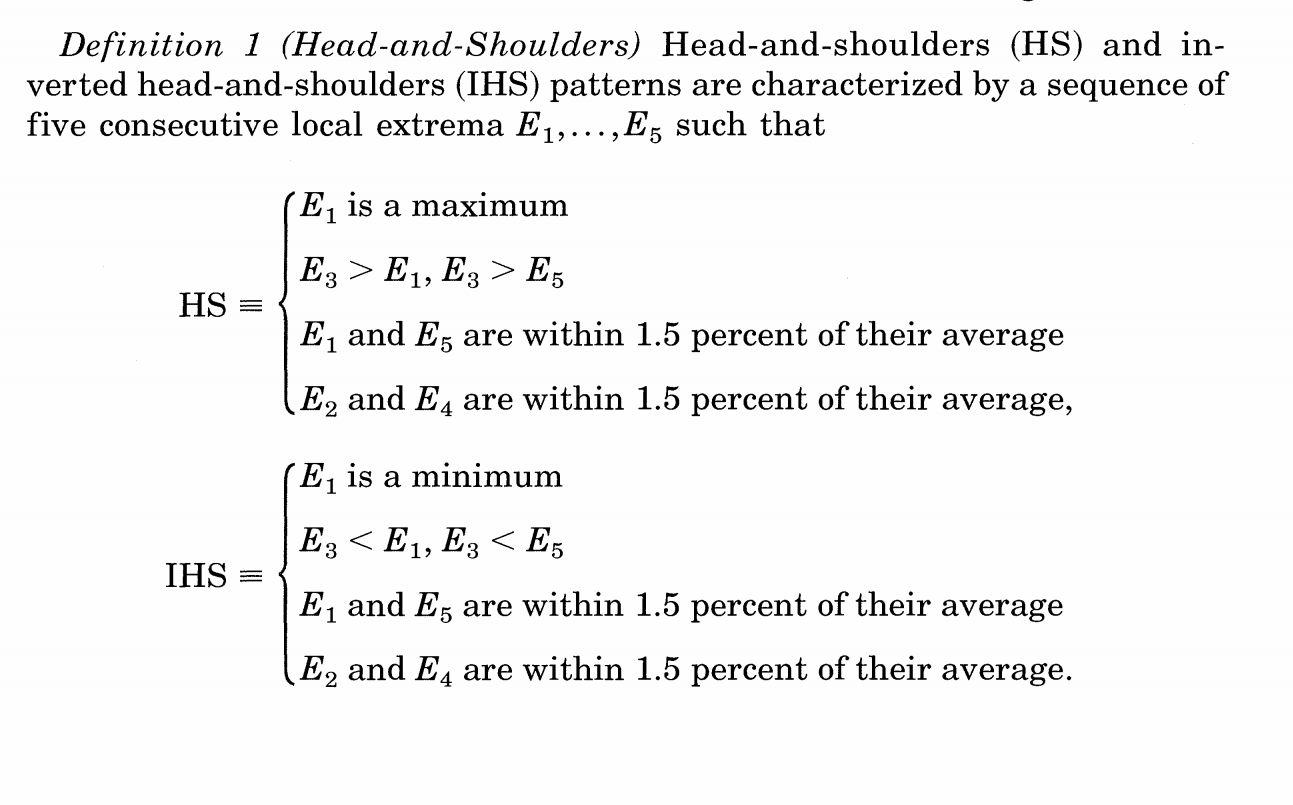
It is a very intuitive definition, but far from perfect in terms of the detection. First of all, this pattern is purely determined by five consecutive local extrema which varies on both time and price scales. Secondly, there is no design space for ambiguity in the definition. It leads to no probabilistic measurement and eventually lose the quantitative analysis ability.
TBD...
